7. Core Services user guide#
7.1. Introduction#
This documents describes the use of the GMT OCS Core Services. The OCS Architecture Documment [ref] describes the overall design of the OCS and provides a description of the function and architecture of the OCS Core Services. In short the Core Services are part of the OCS distributed architecture and provides services that the OCS distributed Components can use to perform their function. The following diagram shows the OCS Core Services in the context of the overall OCS.
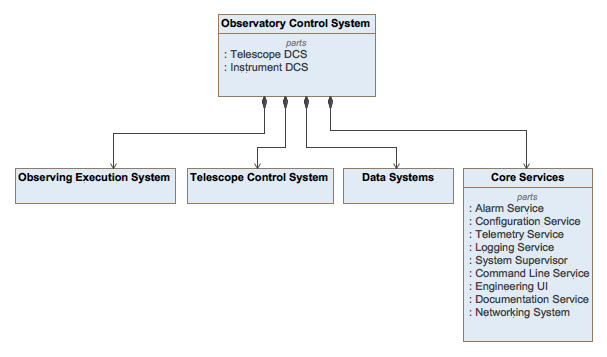
Fig. 7.9 Core Services in the context of the OCS#
The Core Services that are available in the latest release are:
Logging Service
Alarm Service
Telemetry Service
Configuration Service
Supervisory Service
Although the fuctions offered by each service are orthogonal to each other, all of them share similar design and operation principles. The implementatio of the services is distributed and consists of the following components:
A Service Adapter that allows Components to access the interface of the Service. The Core Framework presents the Service Adapters to the the Component base class via dependency injection, making the Core Services available to every Component in the system.
A Service Server (or Servers) that process the data relative to the specific service. All the Core Services transport and process data in the form of Events. The Service Server makes the Events persistent and allows other Components to subscribe to the Events. It is also capable of receiving querys and reply with the result of executing the query in the Service Database. The Service Server is instanciated as part of each Service Server Application.
A Service Database that is stores each server data.
A Service Client that allows to interact with the Server. The Service Client can be instaciated by a Component. A Service Client Application is provided that facilitates interacting with each Service from the command line.
7.2. Service Usage#
This section describes the usage of the different components of each service. As all the services support the same options and operate in a similar way, examples of the usage of different services are included in the descriptions. The following command line application are installed as part of the SDK:
Service
Application
Alarm
alarm_server
Alarm
alarm_client
Configuration
conf_server
Configuration
conf_client
Logging
log_server
Logging
log_client
Supervision
sup_server
Supervision
sup_client
Telemetry
tele_server
Telemetry
tele_client
7.2.1. Service Server Application#
Description
The <service>_server command line application starts the alarm service server.
For the purposes of developing and testing software components with the SDK it is
recommended to start the service with the default options or with the logging set
to debug in case of troubleshooting.
λ alarm_server&

# -> will start the server with default options (recommended)

λ alarm_server --logging debug

# -> will start the server with default options and will output debug log messages (recommended for troubleshooting)
The following section shows the execution of the help command and the available options.
λ alarm_server --help

If called without options alarm_server_app will use default values for them

 Options:
 --version        Show version number                                                      [boolean]
 --name           name of the configurable entity             [string] [default: "alarm_server_app"]
 --scope          scope to load the configuration file                  [string] [default: "global"]
 --config         name of the component configuration to be applied    [string] [default: "default"]
 --auto_conf      load the configuration from file if it exists            [boolean] [default: true]
 --logging        logging level                                           [string] [default: "info"]
 --ctnr_config    name of the container configuration file             [string] [default: "default"]
 --server_config  Name of the service server configuration file        [string] [default: "default"]
 --db_uri                                           [string] [default: "mongodb://127.0.0.1:27017/"]
 --database       Name of the service database                     [string] [default: "gmt_alarm_1"]
 --collection     Name of the service collection                  [string] [default: "alarm_events"]
 --help           Show help                                                                [boolean]

 For more information, find our manual at https://gmto.github.io/gmt_docs/
Options
--server_config
This option specifices the name of the Server configuration to be loaded during the Server startup. The configuration defines the port configuration of each server. The following example shows the configuration of the Alarm Server. Configurations are stored in $GMT_LOCAL/etc/conf
module.exports =
    properties:
        uri:         {name: "uri",         storage: 0,  default_value: 'gmt://127.0.0.1:12000/alarm_sys/alarm_server'}
        name:        {name: "name",        storage: 0,  default_value: 'alarm_server'}
        host:        {name: "host",        storage: 0,  default_value: '127.0.0.1'}
        port:        {name: "port",        storage: 0,  default_value: 12000}
        scan_rate:   {name: "scan_rate",   storage: 0,  max_rate: 0.2, default_value: 1}
        acl:         {name: "acl",         storage: 0,  default_value: 'PRIVATE'}
        db_uri:      {name: "db_uri",      storage: 0,  max_rate: 0.2, default_value: 'mongodb://127.0.0.1:27017/'}
        collection:  {name: "collection",  storage: 0,  max_rate: 1, default_value: 'alarm_events'}
        database:    {name: "database",    storage: 0,  max_rate: 1, default_value: 'gmt_alarm_1'}
    inputs:
        srv_port:    { name: 'srv_port',   storage: 0, port_type: 'pull',  url: 'tcp://127.0.0.1:12101', blocking_mode: 'async', max_rate: 10, nom_rate: 1 }
        query_port:  { name: 'query_port', storage: 0, port_type: 'rep',   url: 'tcp://127.0.0.1:12102', blocking_mode: 'async', max_rate: 10, nom_rate: 1 }
    outputs:
        pub_port:    { name: 'pub_port',   storage: 0, port_type: 'pub',   url: 'tcp://127.0.0.1:12103', blocking_mode: 'async', max_rate: 10, nom_rate: 1 }
    faults:
        db_disconnected: { name: 'db_disconnected', level: 'CRITICAL', kind: 'primary', parent: null }
--database=<name>
The name of the database to be used by the Server
--collection=<name>
The name of the collection to be used by the Server.
Note
Different databases or collections can be used for testing and development purposes. For the purpose of software testing with the SDK, the services have predefined databases and collections.
--help
Outputs the description and options of the application
--logging=<level>
The following table describes the different values available for the
loggingoption
<level>
Abbr
Description
fatal
FTL
fatal - errors which make the application unusable
error
ERR
error - errors that preclude to achive an specific request
warning
WRN
warning - problems that may caused that the result achieved may not be the expected
info
INF
info - information about the general execution of the application
debug
DBG
debug - information to provide an understanding of the internal of the application
trace
TRC
trace - information that may server to identify a potential problem
metric
MET
metric - information to record performance metrics relative to the execution of the application
--name=<name>
application name
--scope=<local|global>
This option defines where the application should search for the Server and Container configuration file. When set to
localthe file will be search in $GMT_LOCAL/etc/conf/<service_dir>/ When set toglobalthe file will be search in $GMT_GLOBAL/etc/conf/<service_dir>/
--config=<name>
This option defines the name of the Application configuration.
--ctnr_config=<name>
This option defines the name of the application Container configuration.
Note
The options
--scope,--config,--ctnr_config,--server_configare intended for the testing of the core services and their deployment in different locations. It should not be necessary to modify them for normal operation of the SDK.
7.2.2. Service Client Application#
Description
The <service>_client command line application starts the service client.
For the purposes of developing and testing software components with the SDK it is
recommended to start the service client with the default options or with the logging set
to debug in case of troubleshooting.
λ tele_client

# -> will start the client with default options (recommended)

λ tele_client --logging debug

# -> will start the server with default options and will output debug log messages (recommended for troubleshooting)
The following section shows the execution of the help command and the available options.
λ alarm_client --help

Usage: alarm_client_app [options]

If called without options alarm_client_app will use default values for them

 Commands:
 alarm_client_app query   queries the service database using the mongodb query syntax
 alarm_client_app listen  Connects to the service server and subscribes to incoming
                         messages

 Options:
 --version        Show version number                                                        [boolean]
 --name           name of the configurable entity               [string] [default: "alarm_client_app"]
 --scope          scope to load the configuration file                    [string] [default: "global"]
 --config         name of the component configuration to be applied      [string] [default: "default"]
 --auto_conf      load the configuration from file if it exists              [boolean] [default: true]
 --logging        logging level                                             [string] [default: "info"]
 --ctnr_config    name of the container configuration file               [string] [default: "default"]
 --client_config  name of the client configuration file                  [string] [default: "default"]
 --help           Show help                                                                  [boolean]

 Examples:
 alarm_client_app query -e '{src: "test_cmp"}'  -r 20
 alarm_client_app query -e '{src: "test_cmp"}'  -r 20 -s
 alarm_client_app listen
 alarm_client_app listen -s

 For more information, find our manual at https://gmto.github.io/gmt_docs/
Commands
listen
The following section shows the the help of the listen command and the available options.
λ alarm_client listen

 Connects to the service server and subscribes to incoming messages

 Options:
 --version        Show version number                                                       [boolean]
 --name           name of the configurable entity              [string] [default: "alarm_client_app"]
 --scope          scope to load the configuration file                   [string] [default: "global"]
 --config         name of the component configuration to be applied     [string] [default: "default"]
 --auto_conf      load the configuration from file if it exists             [boolean] [default: true]
 --logging        logging level                                            [string] [default: "info"]
 --ctnr_config    name of the container configuration file              [string] [default: "default"]
 --client_config  name of the client configuration file                 [string] [default: "default"]
 --help           Show help                                                                 [boolean]
 --topic, -t      filters service data frames matching the topic                             [string]
 --save, -s       saves service output to a file                           [boolean] [default: false]
query
The following section shows the the help of the query command and the available options.
λ alarm_client query

 queries the service database using the mongodb query syntax

 Options:
 --version        Show version number                                                        [boolean]
 --name           name of the configurable entity               [string] [default: "alarm_client_app"]
 --scope          scope to load the configuration file                    [string] [default: "global"]
 --config         name of the component configuration to be applied      [string] [default: "default"]
 --auto_conf      load the configuration from file if it exists              [boolean] [default: true]
 --logging        logging level                                             [string] [default: "info"]
 --ctnr_config    name of the container configuration file               [string] [default: "default"]
 --client_config  name of the client configuration file                  [string] [default: "default"]
 --help           Show help                                                                  [boolean]
 --expr, -e       Query expression                                                            [string]
 --records, -r    Maximum number of records to be return by the query commands  [number] [default: 40]
 --save, -s       saves query to file                                       [boolean] [default: false]
Options
--save
Saves service stream to file. The name of the files conforms to the following syntax: for the query command:
<service_app>_query_<pid>.csvand for the listen command:<service_app>_<pid>.csvwhere pid is the process identifier during the execution of the application. The file is saved in the directory where the application was invoked.λ alarm_client listen --save # -> will create the file alarm_client_app_2457.csvNote
The service stream is the data stream that is published by the service server. If a topic is specified in the command line, only the messages matching the topic will be saved to the file. The service client will still output it’s own logging events to the standard output.
--expr=<query_spec>
Sends a query to the service server and returns the result. The query must be writen using the mongodb query syntax [https://docs.mongodb.com/manual/tutorial/query-documents/]
λ log_client --query '{src: "component_name", level: "error"}'

# -> will return the log events of the component "component_name" which level is "error"
Note
The query capability of this command line option are very limited and intented for basic testing purposes. A more advanced interface will be provided in the OCS UI.
--records=<integer>
maximum number of records returned from the query command
--topic=<topic_name>
filters the service data frames in which the
srcfield includes the topicλ tele_client listen --topic=alarm_server # -> will display the telemetry events that have the alarm_server as source λ tele_client listen --topic=alarm_server/s/op_state/value # -> will display the telemetry events corresponding to the op_state state variable of the # alarm server λ tele_client listen --topic=alarm_server/s # -> will display the telemetry events corresponding to all the state variables of the # alarm serverTip
The core services use the following convention to identify the source of events: <instance name>/<feature abbr>/<feature name>/<feature attribute>, where:
instance name: Name of the component instance
feature abbr: Abbreviation that identifies the component feature. The following values are possible:
i: inputs
o: outputs
s: state variables
p: properties
f: faults
a: alarms
feature name: The name of the specific feature (e.g. op_state state_variable)
feature attribute: The attribute of the feature (e.g. value)
--client_config=<name>
name of the service client configuration
--help
prints the description and options of the application
--logging=<level>
See the description of the logging option in the server application above.
--name=<name>
application name
--scope=<local|global>
See the description of the
--scopeoption in the server application above.
--config=<name>
See the description of the
--configoption in the server application above.
--ctnr_config=<name>
See the description of the
--ctnr_configoption in the server application above.Note
The options
--scope,--config,--ctnr_config,--client_configare intended for the testing of the core services and their deployment in different locations. It should not be necessary to modify them for normal operation of the SDK.
7.2.3. Core Services Monitoring#
It’s possible to monitor the execution of the core services by using the grs utility:
λ grs inspect -i 'alarm_server'

# -> will continuouslly display the following information

Timestamp:  Mon Jul 01 2019 13:05:28 GMT-0700 (Pacific Daylight Time) hb#:[0] .........
  { properties:
  { name: 'alarm_server',
      scope: 'global',
      config: 'default',
      auto_conf: true,
      uri: 'gmt://127.0.0.1:12000/alarm_sys/alarm_server',
      host: '127.0.0.1',
      port: 12000,
      scan_rate: 1,
      auto_start: false,
      auto_init: false,
      auto_halt: true,
      auto_shutdown: true,
      acl: 'PRIVATE',
      db_uri: 'mongodb://127.0.0.1:27017/',
      collection: 'alarm_events',
      database: 'gmt_alarm_1' },
  state_vars: { op_state: 'FAULT' },
  inputs: { srv_port: null, query_port: null },
  outputs: { pub_port: null },
  faults: { db_disconnected: 'ACTIVE' },
  alarms: {},
  connectors: {},
  proxies: {} }
  Enter <CTRL-C> to exit
The System Supervisor (sup_server) supervises the health and fault state of the other services. Two type of errors are detected
<server>_not_respondingThis fault occurs when the system supervisor is unable to establish a connection with the corresponding server. This could be due to the server not been started or to a lack of consistency in the configuration files.
<server>_not_operationalThis fault occurs when the system supervisor is able to establish a connection with the corresponding server, but the server op_state state variable is not RUNNING. This could be due to the server losing connection with the database. In this case, inspecting the faulty server will should the db_disconnected error as ‘ACTIVE’
λ grs inspect -i 'sup_server'

# -> will continuouslly display the following information

  Timestamp:  Mon Jul 01 2019 13:10:05 GMT-0700 (Pacific Daylight Time) hb#:[0] .
  { properties:
  { name: 'sup_server',
      scope: 'global',
      config: 'default',
      auto_conf: true,
      uri: 'gmt://127.0.0.1:16000/sup_sys/sup_server',
      host: '127.0.0.1',
      port: 16000,
      scan_rate: 1,
      auto_start: false,
      auto_init: false,
      auto_halt: true,
      auto_shutdown: true,
      acl: 'PRIVATE',
      db_uri: 'mongodb://127.0.0.1:27017/',
      collection: 'super_events',
      database: 'gmt_super_1' },
  state_vars: { op_state: 'FAULT' },
  inputs: { srv_port: null, query_port: null },
  outputs: { pub_port: null },
  faults:
  { services_not_available: 'ACTIVE',
      db_disconnected: 'ACTIVE',
      core_server_not_responding: 'ACTIVE',
      core_server_not_operational: 'ACTIVE',
      alarm_server_not_responding: 'ACTIVE',
      alarm_server_not_operational: 'ACTIVE',
      tele_server_not_responding: 'ACTIVE',
      tele_server_not_operational: 'ACTIVE',
      log_server_not_responding: 'ACTIVE',
      log_server_not_operational: 'ACTIVE',
      conf_server_not_responding: 'ACTIVE',
      conf_server_not_operational: 'ACTIVE' },
  alarms: { critical_fault_alarm: 'NORM' },
  connectors: {},
  proxies: {} }
  Enter <CTRL-C> to exit
In the case that a services has not been started the following error message will be displayed until the corresponding service is started.
λ grs inspect -i 'sup_server'

# -> will continuouslly display the following information

  [ERR] 2019-07-01T20:10:52.311Z [grs_5403] Component [sup_server] disconnected
7.2.4. Service Adapter#
The interface with each service is provided by the specific implementation of the Core Framework: cpp, python, nodeJS. Each framework implementation user guide describes the corresponding Service Adapter API. The following diagram shows an example of how the different parts of the Logging and Telemetry services interact with the rest of the system.
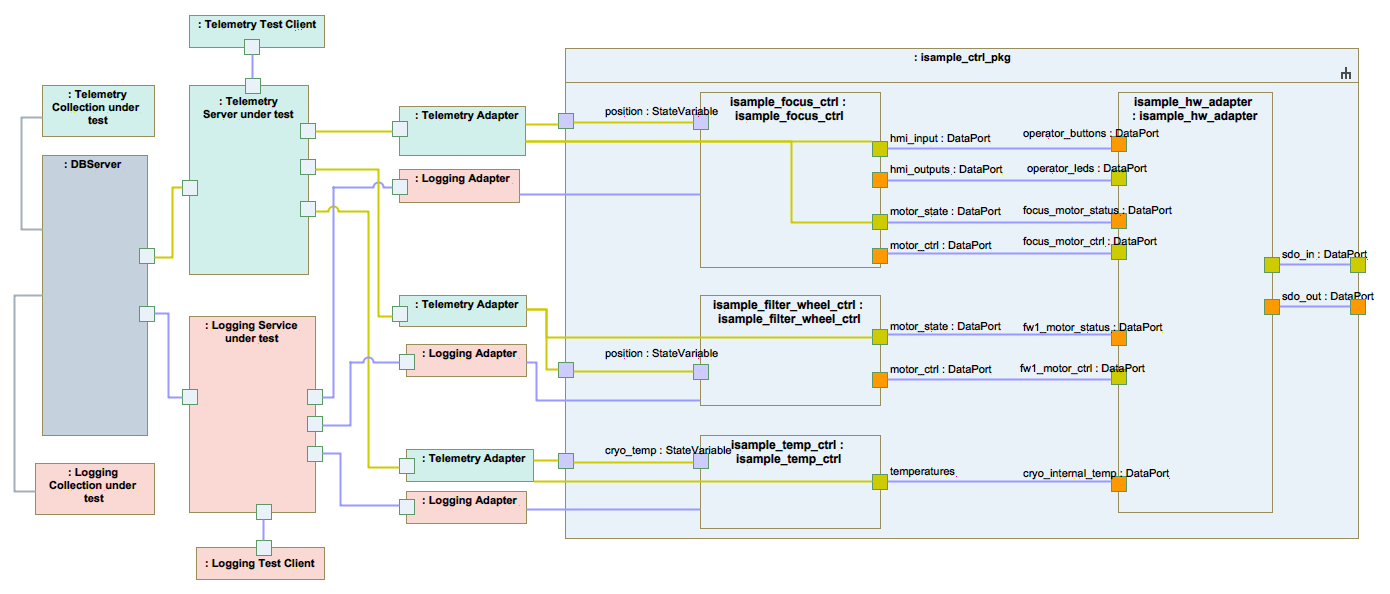
Fig. 7.10 Service operation overview#
7.2.5. Service Database#
The Services database is implemented in mongodb. The installation of mongodb is described in the SDK installation guide. Once the database is installed, the database daemon will be started automatically during the startup process of the hosting machine. The Service Servers take care of initializing the service database and collections. In addition to the installation of the mongodb daemons, the SDK also includes instructions for the installaction of the mongo shell, which permits more sophisticated interaction with the database. The user guide of the mongo shell utility is available in [https://docs.mongodb.com/manual/reference/mongo-shell/].