6.2.5. Alarm Service#
The alarm system, along with the system supervisor and the Interlock & Safety System (ISS), provide functions to assess and manage the overall health of the system. Alarm events are triggered when an alarm condition is detected by a Component (e.g., Controller or Supervisor). Alarm events are time-stamped and include information on the component that has triggered the alarm.
The alarm system associates (using metadata) a set of actions with every alarm event that has to be monitored manually or executed automatically. These actions can include a reference to a workflow or sequence if one has been defined.
Alarm conditions are part of the specification of a component, shown in the following code-block. When a fault condition occurs in a component, it is the responsibility of that component to either handle the fault or to transmit alarms up the supervisory chain until they reach a component that can address the problem, or else eventually up to the operations staff.
EnumType "AlarmSeverity",
    desc: "Defines the severity level of the AlarmEvent"
    literals:
        ALARM_A: ""

StructType "AlarmEvent",
    extends: []
    abstract: false
    desc: "Time stamped Alarm Event"
    elements:
        id:
            type: "string"
            desc: "Alarm ID. Allows associating the alarm with the Alarm description"
        value:
            type: "string"
            desc: "Text message with additional information related to the alarm event occurrence"
        timestamp:
            type: "TimeStamp"
            desc: "Trigger time of the alarm event"
        severity:
            type: "AlarmSeverity"
            desc: "Level of severity of the alarm event"
        source:
            type: "string"
            desc: "URI of the component that has detect the alarm condition"
Service Capabilities
The Alarm System provides the following capabilities:
Notification of alarm events from any component in the system
Analysis of the stream of alarms to identify system health conditions
Filtering of alarms
Storage of alarm events
Visualization of the status of all the alarms in the system
Correlation via timestamp with any other event in the system
Logging operator acknowledgment.
Service Packages
The implementation of the above capabilities is distributed to a set of packages:
Service Package (server & adapter) -
An alarm server system, deployed in several machines, takes care of receiving alarms, storing them and forwarding them to the alarm UI panels, or the alarm analysis system.
In addition to the handling of alarm events, the alarm server provides features that allow managing of load balancing and fault tolerance. The alarm system operation, as with any other component, can be monitored by the telemetry system by specifying monitoring features in its interface (e.g., the number of components connected, the number of active alarms, state of the server, instant alarm throughput).
The following alarm service block diagram shows how distributed components and supervisors access the Alarm Adapter interface to notify an alarm event. Adapters forward the alarm events to the alarm supervisor using push/pull sockets. Usually a single Alarm Adapter is deployed for all the components of a Subsystem that are collocated in the same computer.
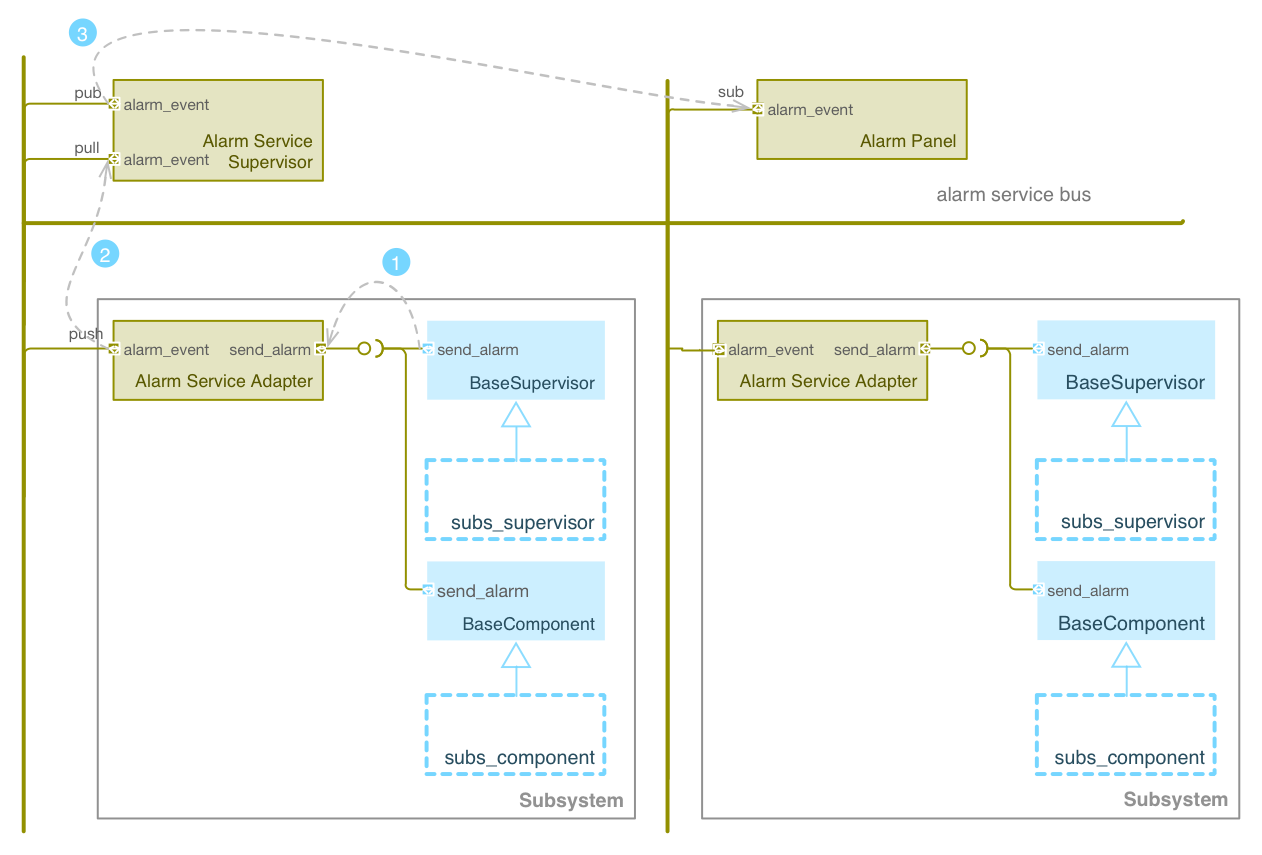
Fig. 6.8 Alarm Service Block Diagram. (1) The component detects an alarm event and invokes the send_alarm method inherited from the BaseComponent or BaseSupervisor classes. (2) The service adapter sends the alarm event to the supervisor using a push socket. The Service supervisor applies the business process rules associated with the alarm event if they are defined. (3) The Service supervisor publishes the event to the subscribed components using a pub socket.#
Analytics Package -
When an alarm is triggered, it may be useful to reconstruct the history and states of a subsystem surrounding that event. The analytics package allows for that possibility. The analysis package components run in real time streaming mode.
Visualization Package -
The visualization package provides custom panels that allow observatory operators to monitor and manage the alarms of the system. This is done implementing several optimize visualizations.
Table 6.9 Alarm Service Visualization Panels# Visualization Panel
Description
Global Panel
Provides an overall view of the status of the alarm system. The following information will be displayed:
State of each telemetry server component (e.g., RUNNING, STOPPED, FAULT)
State of each telemetry adapter component (e.g., RUNNING, STOPPED, FAULT)
List of active monitors
Overall view of the system health, one box per subsystem color coded: - green: No active alarms - yellow: No serious active alarms - red: Critical alarm active
Navigation Panel
Provides a way to navigate all the alarm servers and adapters. From the navigation panel the state and detailed info of every server and adapter can be accessed.
Analytics Panel
Provides access to the runtime statistics of the alarm service. These should include at least.
Number and state (running/stopped/fault)
Instant throughput of the system
Alarms/sec
Total data bandwidth
Persistence capacity (used/available)
Service Deployment
During operation, the alarm system components are deployed in different computers. A simple library is added to every component that allows the sending of alarm events. This is done via a simple API that doesn’t expose any service details to the component.