Health and quality monitoring is central to ensuring that all the hardware,
devices, components, and so on down the line are working properly and safely.
As such, means of monitoring are provided inside many hardware and their
devices at all levels via controller supervisors (which are defined as part of
the SWCS architecture).
The GMT has a large number of distributed Subsystems and Components that are
deployed in different computers or embedded units to implement telescope
control functions. Each Subsystem is required to deploy a Supervisor to
coordinate, monitor, and manage, the health status of its respective software
and hardware Components. In order to guarantee reliability it is important to
monitor and manage the overall health of these Subsystems and Components. The
System Supervisor is thus in charge of the overall health of the system by
watching over the hierarchy. It ensures that the system as a whole can handle
fault tolerance, service availability, and failure detection, thus ensuring
the overall robustness.
The implementation of supervisory functions in a dedicated subsystem allows
the rest of the components to focus on their primary operational functions. It
allows the separation of responsibilities, thus enabling the supervisory
strategies to evolve independently from their subsystems. For example, it is
possible to implement a new supervisory strategy without the need to modify
the application subsystems. This strategy also simplifies the implementation
of the Supervisory Service, as it only has to focus on monitoring and managing
the health of the system. A mix of watchdog, heartbeat, and ping, mechanisms
usually accomplishes this.
The System Supervisor accesses the database to load runtime system
configurations appropriate to a given operation mode (e.g., only the health of
focal stations that are considered active or standby or the hardware installed
on the telescope, FSM vs. ASM, are being monitored).
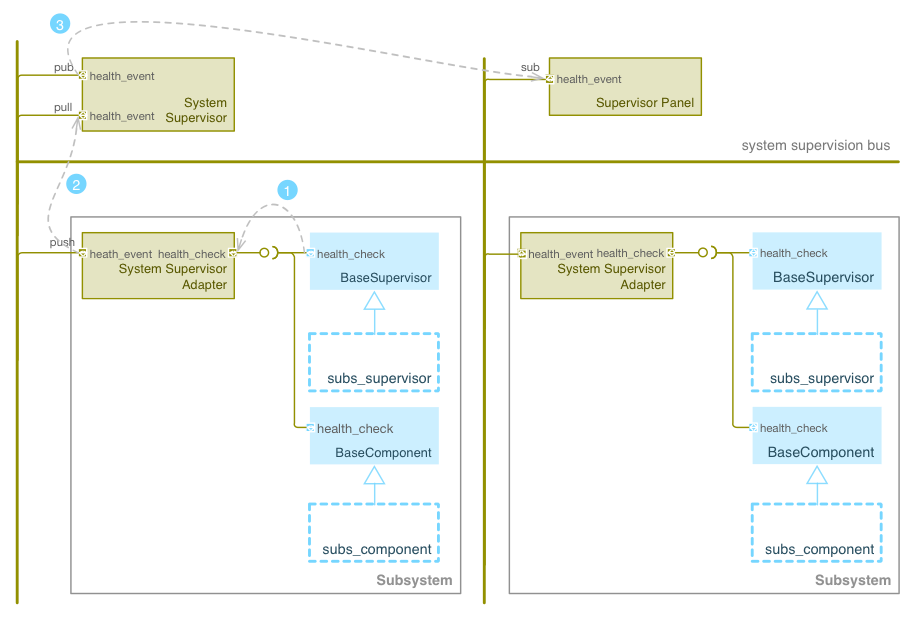
Fig. 6.5 System Supervisor Service Block Diagram. (1) A component creates a
health event and invokes the health_check method inherited from the
BaseComponent or BaseSupervisor classes. (2) A service adapter sends the
health event to the supervisor using a push socket. (3) The service
supervisor forwards the event to the subscribed components using a pub
socket.#
The above System Supervisor design is inspired by Erlang/OTP which is one of
the most reliable systems. It is designed to recover easily from fault
conditions. The emphasis in Erlang is not so much to reduce the risk of
failure, but to consider fault conditions as part of the nominal scenario so
as to be able to recover from faults quickly and efficiently.
Table 6.4 SWCS System Supervisor Requirements (Level 3)#
Requirement
Statement
System Health
Assessment
Provide the capability to assess the overall health of the system.
Overall System Health
Provide the capability of continuous performance, status, and
system health monitoring.
Interlock Safety
System Interface
Interface with the ISS to ensure the safe operation of the system.
Service Capabilities
The System Supervisor provides the following capabilities:
Coordinates the GMT automatic start-up and shutdown procedures
Starts and shuts down the subsystem hardware
Re-starts any SWC subsystem that crashes
Re-starts any SWC subsystem when requested by a user
Ensures that all the subsystems required by a given operation mode are in
nominal operation state (e.g., ping/watchdog)
Enables users to query the health of all subsystems at various
granularities. Querying may be performed via user interfaces at high levels,
and direct command line interfaces at low levels. The query system will
allow users to learn about devices, commands, and meaning of the parameters
and outputs, on-line and interactively.
Manages optimal information flow to inform human supervisors. This
involves processing and filtering of information.
Provides effective and efficient visualization displays that adequately
capture the overall health of the observatory, telescope, instruments, and
weather environment.
Reports host information: Operating system resources usage, version of
operating system and installed software, version of every software module,
validation vs. specified configuration.
Enables automated localization and alert of problems and devices that do
not operate within nominal ranges, or environmental conditions that endanger
the safety of the telescope or observatory.
Reports information about the processes running in the system: start time,
status, etc.
Administers the system deployment model
Redeploys a service or process in an alternative computer if the one
assigned becomes unresponsive.
Implements secondary fault tolerance and load balancing. (The system
supervisor, analyses the load of the different services and may deploy
additional resources to address additional demands)
Detects health of the underlying communication infrastructure
Implements an Observatory Wide rule system to match global rule conditions
and trigger associated actions.
Acts as a Supervisor of supervisors. Each subsystem is required to deploy
a Subsystem supervisor.
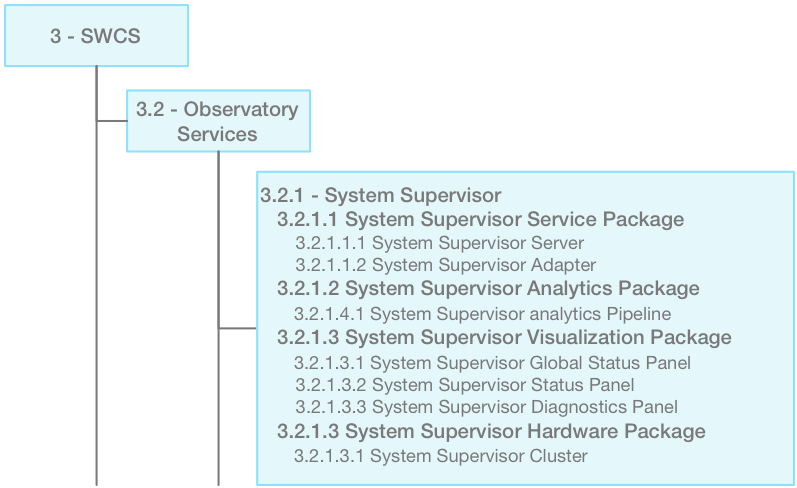
Service Packages
The System Supervisor Subsystem is organized in the following configuration:
A supervisory server system, deployed in several machines, takes care of
implementing the System Supervisory functions. Additionally the system
supervisor server provides features that allow managing of load balancing
and fault tolerance. The system supervisor operation, as with any other
component, can be monitored by the telemetry system defining monitoring
features in its interface (e.g., the number of components connected,
number of active alarms, state of the server, instant alarm throughput).
Analytics Package -
The analytics package provides the following capabilities:
Allows reconstructing the history of the health of the system.
Allows the analysis package components to run in real time streaming mode.
Triggers any action associated with the system supervisor rules.
Visualization Package -
The visualization package provides custom panels that allow observatory
operators to monitor and manage the System Supervision System, summarized
in the following table:
Provides an overall view of the status of the supervisor system. The following
information will be displayed:
State of each telemetry server component (e.g., RUNNING, STOPPED, FAULT)
State of each telemetry adapter component (e.g., RUNNING, STOPPED, FAULT)
List of active monitors
Overall view of the system health, one box per subsystem color coded:
green: No active monitors in fault state
yellow: No serious active alarms
red: The monitor system is not working
Global life-cycle actions (global start and stop of the system, switching
modes)
Note: State information shall be color-coded.
Navigation Panel
Provides a way to navigate all the monitor servers and adapters. From the
navigation panel the state and detailed info of every server and adapter can be
accessed.
Guide Panel
Displays the on line documentation of the system supervisor service.
Allows access to the user guide as well as the metadata (model information) of
the runtime objects.
Analytics Panel
Provides access to the runtime statistics of the supervisor service.
These should include at least.
Number and state (running/stopped/fault)
Instant throughput of the system
Total and Subsystem Monitor samples/sec
Total data bandwidth
Persistence capacity (used/available)
Service Deployment
The System Supervisor service is a distributed system; it consists of
several components running on different computers in the GMT control
network. A System Supervisor server is deployed in one of the Sever Class
Computers in the electronics room. Each SWCS subsystem is required to deploy
a Subsystem Supervisor Component in the corresponding computer. It is
important to emphasize that all of the SWCS subsystems are required to
deploy a supervisor, this includes not only Device control Subsystems but
also user interface applications.
The visualization package components are deployed in the control room
Operation Support Computers.