7.8. User Interface Framework#
The User Interface Framework (UIF) provides a set of common reusable Widgets (user interface graphic elements) and Panels. Widgets and Panels are the building blocks used to construct the GMT user interfaces. The Table below provides a list of some of these components, based on d3.js.
Widget Name |
Description |
|---|---|
Scalar |
Visualizes the instant numeric value of a quantity. |
Line/Area chart |
Visualizes the value of a quantity or set of quantities versus another. |
Time chart |
Visualizes and updates the value of a quantity or set of quantities versus time. |
Box plot |
Summarizes a quantitative distribution with five standard statistics: The smallest value, lower quartile, median , upper quartile, and largest value. |
Bullet chart |
Compares a given quantitative measure against qualitative ranges (e.g., linear position and limit ranges). |
Calendar view |
Visualizes values as colored cells per day. |
Treemap |
Recursively subdivides area into rectangles, the area of any node in the tree corresponds to its value (e.g., visualization of subsystem and components alarm states). |
Chord diagram |
Shows directed relationships among a group of entities. |
Matrix diagram |
Visualizes an NxN relationship (e.g., active component port connections in a wavefront control observing mode). |
Crossfilter |
Supports exploration of large multivariable datasets. |
WFS RT display |
Displays WFS pixels, slopes in realtime (24fps). |
Image viewer |
Supports the visualization of FITS data. |
As in previous cases the use of a framework facilities a consistent design and documentation, improves system predictability as all widgets operate consistently in different scenarios, and reduces development costs.
In addition to reusable components the framework defines some user interface guidelines:
Shape, size and color attributes are used only when they carry specific semantics [Tuft01].
The user interface style is flat with no bevels or tridimensional effects.
No decoration shall be used if it does not convey any semantics.
The user interface shall support the exploration of available options in a clear, unambiguous way.
In any operational context, information shall be readily visible and available without a user having to hunt around, such as by navigating series of pull-down menus or layers.
Users normally perform tasks following workflows, therefore visual information shall support the process of decision making related to the task at any given moment.
Information shall be displayed using the appropriate visualization for the task context.
The layout of the Operations interface shall be fixed for the most part. This guarantees that the information relevant to the operation of the system is always visible. Although part of the user interface shall be flexible to adapt to the task at hand, the fixed part of the user interface enables different users of the system to adopt a common language and vocabulary.
All the remote operations centers shall have a consistent layout. This facilitates support and troubleshooting tasks.
User interface components shall be arranged according to a logical sequence that enables one to intuit where, on a screen, an element would be located. Two main criteria shall be used, physical distribution and temporal distribution:
Physical distribution – Widgets that represent the state of a system shall be arranged according to the geometric organization of the physical elements, e.g., in the main status screens all user interface components are arranged from left to right following the location of the systems from the outside to the inside.
Temporal distribution – All the widgets that support the operation workflows of the observatory are arranged following the same distribution as a Kanban diagram. Section 10.3.3.4 (Operational User Interfaces, TBA) shows the main operation displays, which follow this principle.
The Figure below shows an example of the design of a widget according to these principles. A detailed description of all the widgets is out of the scope of this document.
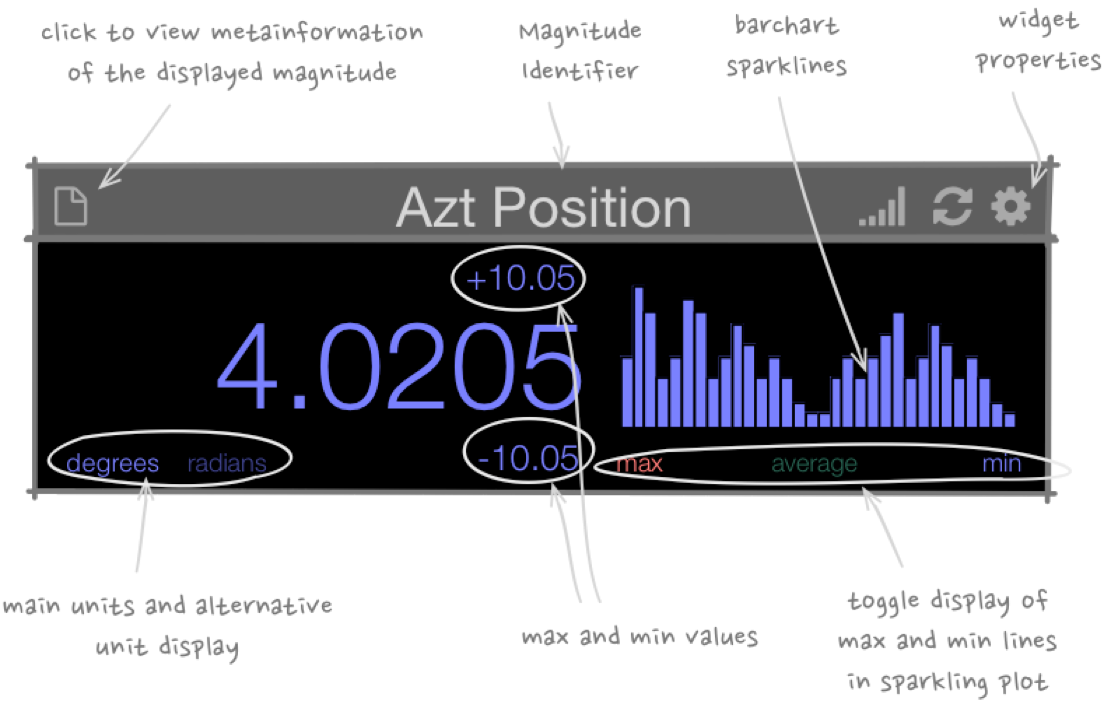
Fig. 7.7 Scalar Widget Design#